
Image
Canva
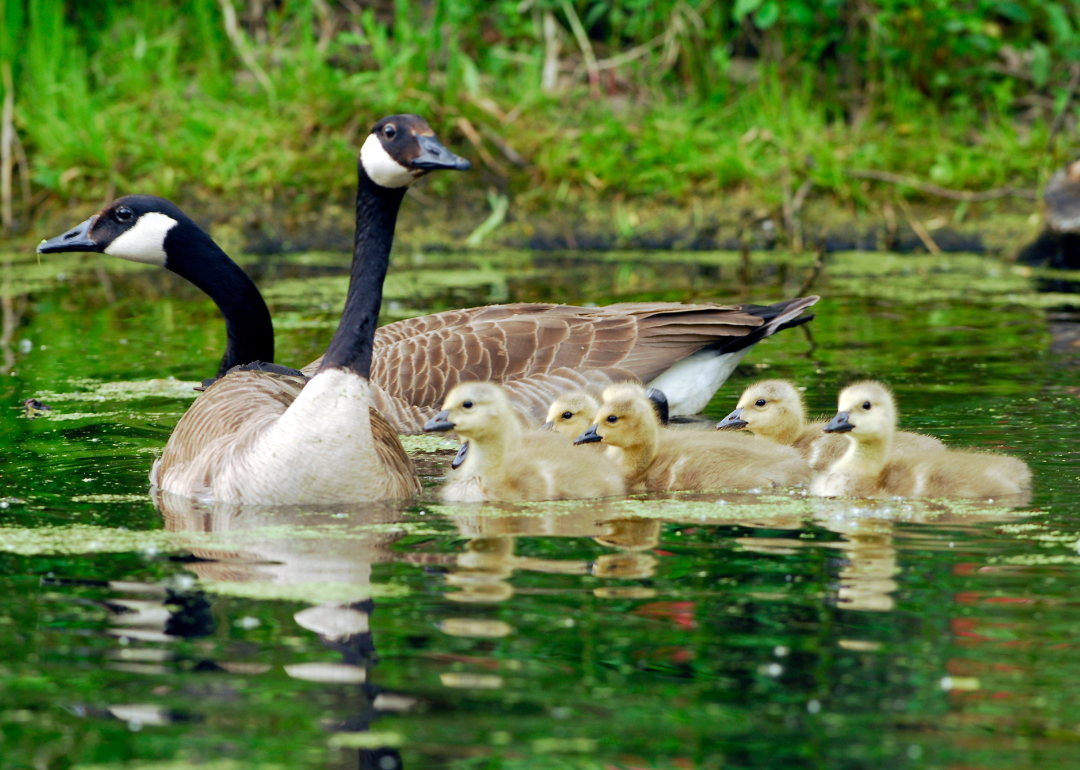
Project FeederWatch, a citizen science project where participants collect data on birds at their feeders, was founded in Ontario by Erica Dunn and the Long Point Bird Observatory in 1976. The project partnered with the Cornell Lab of Ornithology after 10 years to scale the project across the U.S. and Canada and now has over 20,000 participants.
The data Project FeederWatch collects is used by scientists to understand trends in bird populations. If you would like to participate as a FeederWatcher you can learn more about the project here.
Read on to see which birds are most commonly seen in your state.
You may also like: Most popular girl names in the 60s in Michigan
- Sites visited Dec. 24 to Jan. 6: 1%
- Average group size: 1.25
- States with the highest percent of sites visited
--- #1. Georgia: 58%
--- #2. Mississippi: 55%
--- #2. South Carolina: 55%
--- #4. North Carolina: 34%
--- #5. Alabama: 33%

- Sites visited Dec. 24 to Jan. 6: 1%
- Average group size: 1.42
- States with the highest percent of sites visited
--- #1. Washington: 24%
--- #1. Oregon: 24%
--- #3. Oklahoma: 18%
--- #4. California: 15%
--- #5. Kentucky: 10%
- Sites visited Dec. 24 to Jan. 6: 1%
- Average group size: 1.47
- States with the highest percent of sites visited
--- #1. Florida: 29%
--- #2. New Jersey: 27%
--- #3. Delaware: 22%
--- #4. Arkansas: 21%
--- #5. Tennessee: 16%
- Sites visited Dec. 24 to Jan. 6: 1%
- Average group size: 3.19
- States with the highest percent of sites visited
--- #1. Alaska: 32%
--- #2. Minnesota: 6%
--- #3. Colorado: 2%
--- #3. Maine: 2%
--- #5. Michigan: 1%
- Sites visited Dec. 24 to Jan. 6: 1%
- Average group size: 7.47
- States with the highest percent of sites visited
--- #1. Oklahoma: 6%
--- #2. Rhode Island: 3%
--- #3. Georgia: 2%
--- #3. Connecticut: 2%
--- #3. Indiana: 2%
You may also like: Counties in Michigan where people spend most of their paycheck on housing

- Sites visited Dec. 24 to Jan. 6: 2%
- Average group size: 1.37
- States with the highest percent of sites visited
--- #1. Alaska: 4%
--- #2. Montana: 3%
--- #3. Michigan: 2%
--- #3. Wisconsin: 2%

- Sites visited Dec. 24 to Jan. 6: 2%
- Average group size: 1.39
- States with the highest percent of sites visited
--- #1. Nevada: 73%
--- #2. California: 69%
--- #3. Arizona: 59%
--- #4. New Mexico: 31%
--- #5. Washington: 20%
- Sites visited Dec. 24 to Jan. 6: 2%
- Average group size: 1.51
- States with the highest percent of sites visited
--- #1. Iowa: 9%
--- #1. Mississippi: 9%
--- #3. Kentucky: 6%
--- #4. Tennessee: 5%
--- #4. Kansas: 5%

- Sites visited Dec. 24 to Jan. 6: 2%
- Average group size: 1.6
- States with the highest percent of sites visited
--- #1. Alabama: 23%
--- #2. Ohio: 15%
--- #3. Tennessee: 14%
--- #3. Florida: 14%
--- #3. Delaware: 14%
- Sites visited Dec. 24 to Jan. 6: 2%
- Average group size: 2.09
- States with the highest percent of sites visited
--- #1. Alaska: 46%
--- #2. Michigan: 2%
You may also like: Best high schools in Michigan

- Sites visited Dec. 24 to Jan. 6: 2%
- Average group size: 2.45
- States with the highest percent of sites visited
--- #1. Alaska: 21%
--- #2. South Dakota: 6%
--- #3. West Virginia: 3%
--- #4. Michigan: 2%
--- #4. New Hampshire: 2%
- Sites visited Dec. 24 to Jan. 6: 2%
- Average group size: 2.56
- States with the highest percent of sites visited
--- #1. Oklahoma: 35%
--- #2. Mississippi: 27%
--- #3. Colorado: 23%
--- #4. Texas: 20%
--- #5. Utah: 19%

- Sites visited Dec. 24 to Jan. 6: 2%
- Average group size: 3.8
- States with the highest percent of sites visited
--- #1. Nevada: 27%
--- #2. South Dakota: 18%
--- #3. Arizona: 17%
--- #4. New Mexico: 16%
--- #5. New York: 6%

- Sites visited Dec. 24 to Jan. 6: 2%
- Average group size: 6.86
- States with the highest percent of sites visited
--- #1. Texas: 16%
--- #2. Mississippi: 9%
--- #2. Idaho: 9%
--- #4. South Carolina: 8%
--- #5. North Carolina: 7%

- Sites visited Dec. 24 to Jan. 6: 3%
- Average group size: 1.0
- States with the highest percent of sites visited
--- #1. Idaho: 16%
--- #2. Missouri: 7%
--- #2. Kansas: 7%
--- #2. Utah: 7%
--- #5. Connecticut: 6%
You may also like: Most popular girl names in the 80s in Michigan
- Sites visited Dec. 24 to Jan. 6: 3%
- Average group size: 1.06
- States with the highest percent of sites visited
--- #1. Nevada: 20%
--- #2. Mississippi: 9%
--- #3. Tennessee: 6%
--- #3. Connecticut: 6%
--- #3. Massachusetts: 6%

- Sites visited Dec. 24 to Jan. 6: 4%
- Average group size: 2.11
- States with the highest percent of sites visited
--- #1. New Mexico: 39%
--- #2. Colorado: 16%
--- #3. Arizona: 15%
--- #4. Maine: 14%
--- #5. Alabama: 10%
- Sites visited Dec. 24 to Jan. 6: 4%
- Average group size: 5.09
- States with the highest percent of sites visited
--- #1. New Mexico: 17%
--- #2. New Hampshire: 12%
--- #2. Vermont: 12%
--- #4. Maine: 9%
--- #5. Colorado: 7%

- Sites visited Dec. 24 to Jan. 6: 5%
- Average group size: 1.31
- States with the highest percent of sites visited
--- #1. Arkansas: 79%
--- #2. Maryland: 74%
--- #3. New Jersey: 70%
--- #4. Virginia: 68%
--- #5. Delaware: 67%
- Sites visited Dec. 24 to Jan. 6: 5%
- Average group size: 2.0
- States with the highest percent of sites visited
--- #1. Mississippi: 27%
--- #2. Arkansas: 25%
--- #2. Georgia: 25%
--- #4. Missouri: 23%
--- #5. North Carolina: 22%
You may also like: Most popular boy names in the 80s in Michigan

- Sites visited Dec. 24 to Jan. 6: 5%
- Average group size: 6.71
- States with the highest percent of sites visited
--- #1. New Hampshire: 17%
--- #2. Vermont: 14%
--- #2. Maine: 14%
--- #4. Wyoming: 12%
--- #5. Montana: 10%

- Sites visited Dec. 24 to Jan. 6: 8%
- Average group size: 1.08
- States with the highest percent of sites visited
--- #1. Arkansas: 17%
--- #2. Oklahoma: 12%
--- #3. Maine: 11%
--- #4. Indiana: 10%
--- #5. Maryland: 8%

- Sites visited Dec. 24 to Jan. 6: 8%
- Average group size: 1.39
- States with the highest percent of sites visited
--- #1. Washington: 57%
--- #2. Kentucky: 54%
--- #3. Oregon: 49%
--- #4. West Virginia: 38%
--- #4. Pennsylvania: 38%
- Sites visited Dec. 24 to Jan. 6: 10%
- Average group size: 2.4
- States with the highest percent of sites visited
--- #1. Nevada: 47%
--- #2. Tennessee: 41%
--- #2. North Carolina: 41%
--- #4. Washington: 39%
--- #4. New Mexico: 39%
- Sites visited Dec. 24 to Jan. 6: 10%
- Average group size: 3.02
- States with the highest percent of sites visited
--- #1. Georgia: 67%
--- #2. North Carolina: 63%
--- #3. South Carolina: 60%
--- #4. Mississippi: 55%
--- #5. Virginia: 50%
You may also like: Where people in Michigan are moving to most

- Sites visited Dec. 24 to Jan. 6: 15%
- Average group size: 1.0
- States with the highest percent of sites visited
--- #1. Nevada: 33%
--- #2. Arizona: 24%
--- #3. Kentucky: 21%
--- #4. New Jersey: 20%
--- #5. Illinois: 17%

- Sites visited Dec. 24 to Jan. 6: 15%
- Average group size: 1.1
- States with the highest percent of sites visited
--- #1. Montana: 72%
--- #2. Colorado: 67%
--- #3. Washington: 65%
--- #4. Oregon: 62%
--- #5. Nevada: 53%

- Sites visited Dec. 24 to Jan. 6: 19%
- Average group size: 1.16
- States with the highest percent of sites visited
--- #1. North Carolina: 84%
--- #1. South Carolina: 84%
--- #3. Georgia: 81%
--- #4. Alabama: 80%
--- #5. Virginia: 79%
- Sites visited Dec. 24 to Jan. 6: 19%
- Average group size: 1.17
- States with the highest percent of sites visited
--- #1. Minnesota: 36%
--- #2. Michigan: 19%
--- #2. Wisconsin: 19%
--- #4. Indiana: 18%
--- #5. West Virginia: 15%

- Sites visited Dec. 24 to Jan. 6: 19%
- Average group size: 2.19
- States with the highest percent of sites visited
--- #1. Oklahoma: 44%
--- #2. Maine: 42%
--- #2. Arkansas: 42%
--- #4. Minnesota: 38%
--- #5. Virginia: 32%
You may also like: Most diverse counties in Michigan
- Sites visited Dec. 24 to Jan. 6: 24%
- Average group size: 2.04
- States with the highest percent of sites visited
--- #1. Wisconsin: 32%
--- #2. South Dakota: 24%
--- #2. Michigan: 24%
--- #4. Vermont: 23%
--- #5. New York: 20%
- Sites visited Dec. 24 to Jan. 6: 34%
- Average group size: 3.26
- States with the highest percent of sites visited
--- #1. Indiana: 74%
--- #2. Kentucky: 69%
--- #3. Ohio: 67%
--- #4. Delaware: 64%
--- #5. Missouri: 56%
- Sites visited Dec. 24 to Jan. 6: 48%
- Average group size: 1.31
- States with the highest percent of sites visited
--- #1. Maine: 71%
--- #2. Alaska: 61%
--- #3. Washington: 50%
--- #4. Wisconsin: 48%
--- #4. Michigan: 48%
- Sites visited Dec. 24 to Jan. 6: 53%
- Average group size: 1.31
- States with the highest percent of sites visited
--- #1. Vermont: 72%
--- #2. Maine: 69%
--- #3. New Hampshire: 63%
--- #4. Minnesota: 62%
--- #5. Connecticut: 61%
- Sites visited Dec. 24 to Jan. 6: 59%
- Average group size: 3.72
- States with the highest percent of sites visited
--- #1. Arizona: 91%
--- #2. Kentucky: 87%
--- #3. Colorado: 86%
--- #3. New Mexico: 86%
--- #3. Indiana: 86%
You may also like: Highest-earning counties in Michigan

- Sites visited Dec. 24 to Jan. 6: 59%
- Average group size: 6.89
- States with the highest percent of sites visited
--- #1. Iowa: 91%
--- #2. Illinois: 87%
--- #2. Nebraska: 87%
--- #4. Indiana: 80%
--- #5. Ohio: 79%

- Sites visited Dec. 24 to Jan. 6: 68%
- Average group size: 2.18
- States with the highest percent of sites visited
--- #1. West Virginia: 100%
--- #2. Connecticut: 92%
--- #3. North Carolina: 90%
--- #3. Georgia: 90%
--- #5. Massachusetts: 89%
- Sites visited Dec. 24 to Jan. 6: 72%
- Average group size: 1.14
- States with the highest percent of sites visited
--- #1. West Virginia: 87%
--- #2. Ohio: 81%
--- #3. Connecticut: 80%
--- #4. Kentucky: 79%
--- #5. Indiana: 78%

- Sites visited Dec. 24 to Jan. 6: 72%
- Average group size: 4.52
- States with the highest percent of sites visited
--- #1. Oklahoma: 79%
--- #2. Missouri: 76%
--- #3. Wisconsin: 75%
--- #3. Arkansas: 75%
--- #5. Maine: 74%
- Sites visited Dec. 24 to Jan. 6: 74%
- Average group size: 2.32
- States with the highest percent of sites visited
--- #1. Nebraska: 87%
--- #2. Indiana: 83%
--- #3. Ohio: 82%
--- #4. Iowa: 81%
--- #5. New Jersey: 80%
You may also like: Best counties to raise a family in Michigan

- Sites visited Dec. 24 to Jan. 6: 74%
- Average group size: 4.16
- States with the highest percent of sites visited
--- #1. West Virginia: 87%
--- #1. Kentucky: 87%
--- #3. New Jersey: 86%
--- #4. Mississippi: 82%
--- #4. Indiana: 82%

- Sites visited Dec. 24 to Jan. 6: 76%
- Average group size: 2.47
- States with the highest percent of sites visited
--- #1. Kentucky: 100%
--- #2. Arkansas: 96%
--- #2. Missouri: 96%
--- #4. Maryland: 94%
--- #5. Tennessee: 93%

- Sites visited Dec. 24 to Jan. 6: 77%
- Average group size: 3.95
- States with the highest percent of sites visited
--- #1. Nebraska: 97%
--- #2. Washington: 95%
--- #2. Oregon: 95%
--- #4. Missouri: 92%
--- #4. Delaware: 92%
- Sites visited Dec. 24 to Jan. 6: 82%
- Average group size: 1.47
- States with the highest percent of sites visited
--- #1. Maine: 87%
--- #2. West Virginia: 85%
--- #3. Connecticut: 84%
--- #3. Vermont: 84%
--- #5. Massachusetts: 83%
- Sites visited Dec. 24 to Jan. 6: 87%
- Average group size: 1.63
- States with the highest percent of sites visited
--- #1. Arkansas: 92%
--- #2. Connecticut: 91%
--- #2. Minnesota: 91%
--- #4. Massachusetts: 90%
--- #5. Iowa: 88%
You may also like: 17% of people live near toxic release facilities—here's how it breaks down in Michigan
- Sites visited Dec. 24 to Jan. 6: 91%
- Average group size: 2.78
- States with the highest percent of sites visited
--- #1. Vermont: 98%
--- #2. Maine: 96%
--- #2. Massachusetts: 96%
--- #4. Minnesota: 95%
--- #4. Connecticut: 95%


Sunny, with a high of 80 and low of 51 degrees. Sunny during the morning, clear overnight.


Could a republican possible win as mayor in Saline? Or did Ann Arbor move its woke agenda south to Saline?
“Yeah, empathy and treating people decently has really gotten out of hand.” Your maga brand keeps getting more corrupt by the day.
I look forward to sharing my hard work with the woke agenda.... that is why I worked to hard to share. Sharing that BIDEN love of corruption that he so promoted with his crooked Doctor JILL. So you voted for WORD SALAD? Hope she runs again TRUMP 2028!